
Case Study · The Globe and Mail
Urban Heat Islands Study — City of Toronto
Globe & Mail Commission
How The Globe and Mail Investigated Urban Heat Inequality Across Toronto Neighbourhoods
Satellite-derived Land Surface Temperature data produced for The Globe and Mail's investigation into heat vulnerability and neighbourhood-level climate disparities in the Toronto CMA.
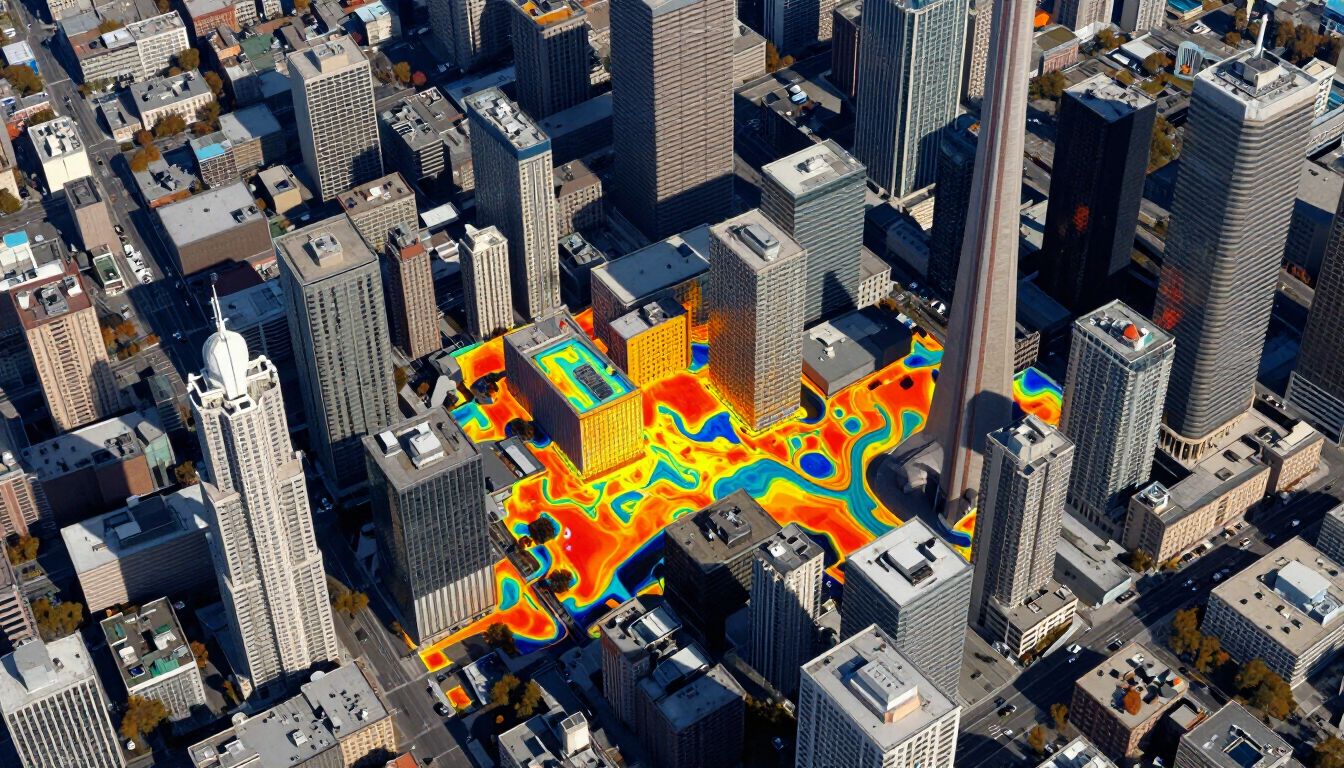
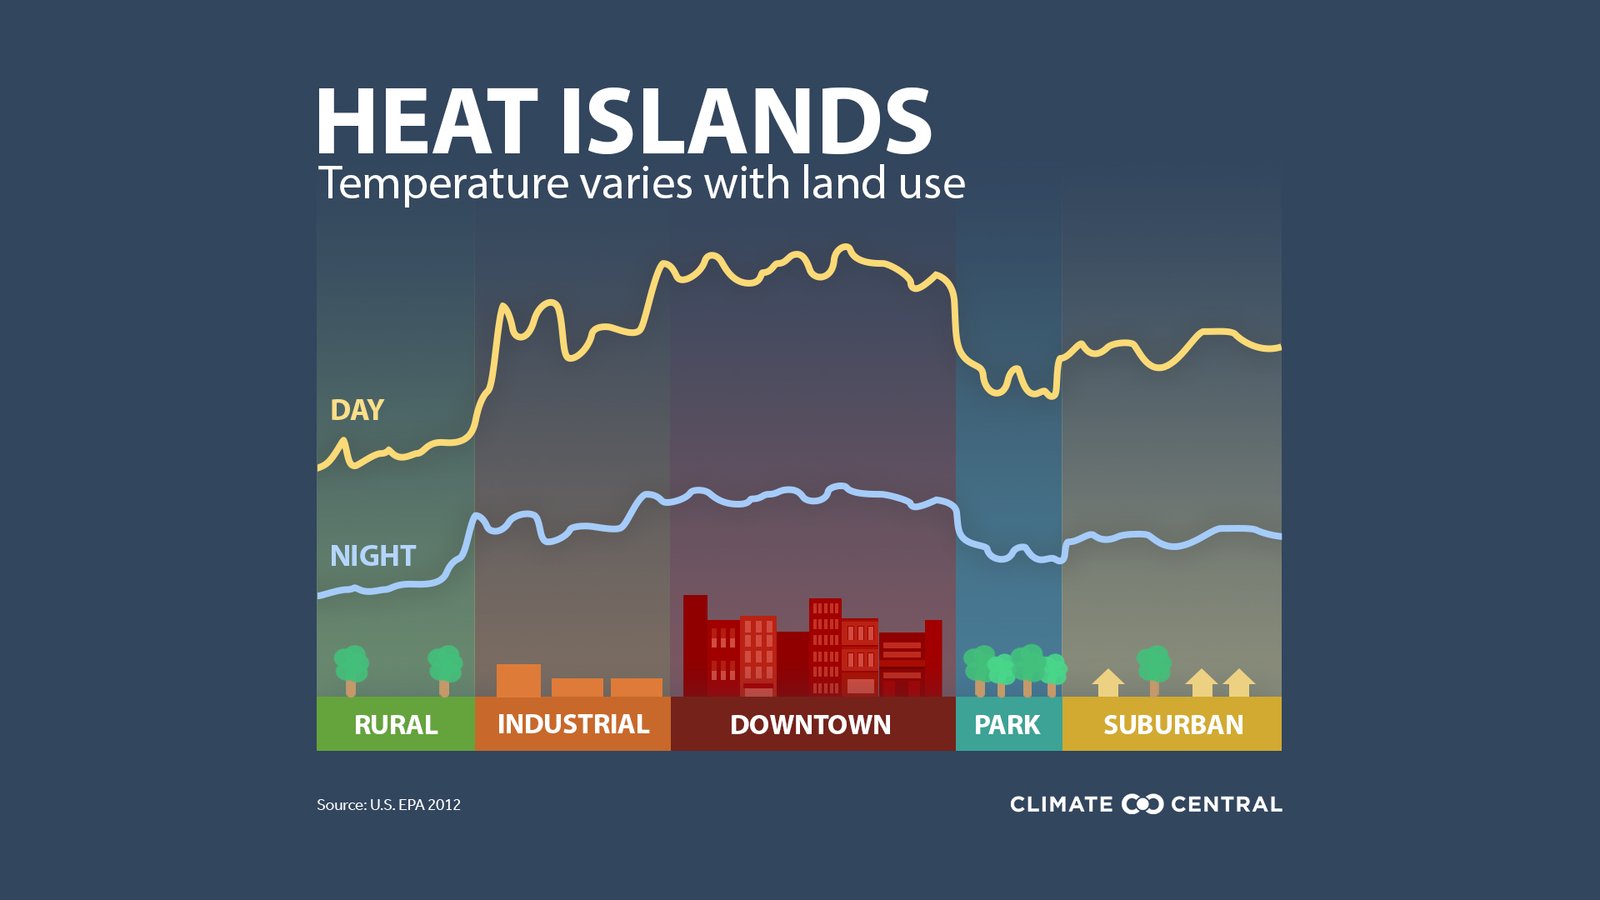
Urban heat islands (UHIs) are metropolitan areas significantly warmer than their surrounding rural environments — a well-documented consequence of urbanization. Impervious surfaces such as asphalt, concrete, and building rooftops absorb solar radiation and re-emit it as heat, while the absence of vegetation eliminates the cooling effect of evapotranspiration. This study maps land surface temperature (LST) across the Toronto Census Metropolitan Area (CMA) using Landsat 8 thermal infrared imagery, providing a spatially explicit, satellite-derived temperature baseline for urban climate research.
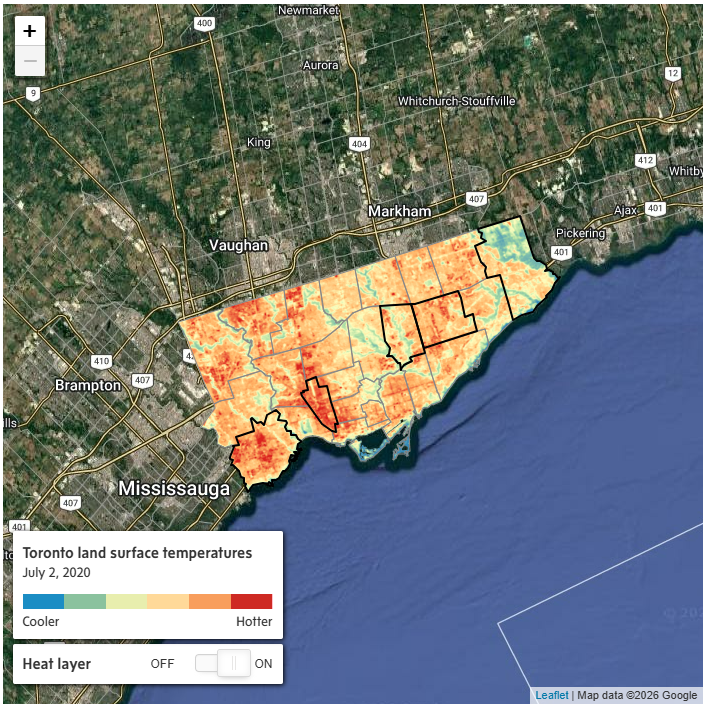
Toronto land surface temperatures, July 2, 2020. Source: The Globe and Mail / Camilo Perez Arrau.
"Prof. Shandas provided The Globe with land surface temperature data for Vancouver and Montreal. Camilo Perez Arrau, a Montreal-based geographer who has studied urban heat in several large Canadian cities, provided imagery for Toronto. Using geographical information system software known as ArcGIS Pro, The Globe cross-referenced these data with satellite imagery, as well as with 2016 census data, to explore patterns in the distribution of heat. We confirmed our observations with local experts."
The analysis used Band 10 (TIRS Channel 1) from Landsat 8 OLI/TIRS, acquired on July 3, 2020 — a clear-sky summer day — to minimize cloud contamination and maximize thermal signal. Radiometric calibration was applied to convert raw digital numbers to top-of-atmosphere brightness temperature, followed by emissivity correction using the NDVI Threshold Method (NDVITHM) derived from Bands 4 and 5. The resulting LST surface was clipped to Statistics Canada's official CMA boundary and visualized with a diverging red-blue color ramp: deep blue for cool surfaces (water bodies, dense vegetation) and deep red for hot zones (downtown cores, industrial corridors, large parking areas).
Results confirm pronounced intra-urban temperature gradients. The downtown Toronto core, Mississauga's industrial waterfront, and Brampton's commercial zones register the highest LST values, consistent with their high impervious surface fraction and lack of tree canopy. Conversely, Lake Simcoe's shoreline, the Oak Ridges Moraine corridor, and Rouge National Urban Park show distinctly lower surface temperatures. This spatial baseline supports evidence-based planning interventions — including targeted tree planting, cool roofs, and permeable pavement programs — to mitigate heat stress and reduce energy consumption for the region's 6+ million residents.
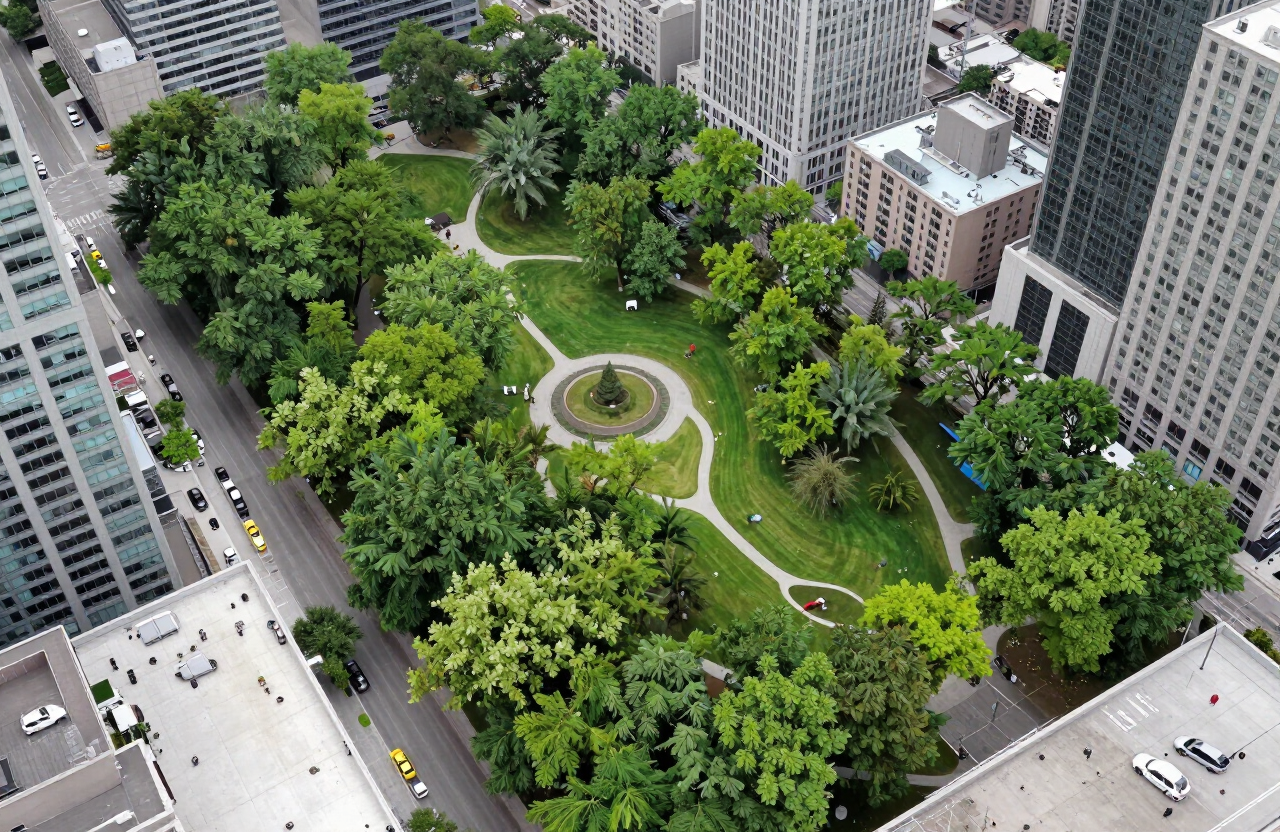
Urban parks and tree canopy provide measurable cooling relief within the urban heat island, as confirmed by the LST analysis.
Data produced for The Globe and Mail
How We Produced the Data for The Globe and Mail
Imagery Acquisition
Landsat 8 OLI/TIRS Collection 2 Level-1 scene (Path 18, Row 30) acquired July 3, 2020, under clear-sky conditions to minimize atmospheric interference.
Radiometric Calibration
Raw digital numbers converted to spectral radiance using scene-specific rescaling factors, then to top-of-atmosphere brightness temperature using the Planck function constants.
Emissivity Correction
NDVI computed from Bands 4 (Red) and 5 (NIR). The NDVITHM method classified pixels as bare soil, mixed, or full vegetation to assign emissivity values and retrieve land surface temperature.
Spatial Analysis
LST raster clipped to the Statistics Canada Toronto CMA polygon. QGIS2web and GeoServer used for styling, rendering, and web publication of the interactive map.
Investigation findings
What The Globe and Mail's Investigation Revealed
- Downtown Toronto core and Mississauga's industrial waterfront register the highest LST values (>42°C), driven by dense building stock and minimal green cover.
- Lake Simcoe and Lake Ontario water bodies act as significant heat sinks, showing LST values 15–20°C below the urban core.
- The Oak Ridges Moraine and Rouge National Urban Park corridors provide measurable cool refugia within the metropolitan area.
- Large surface parking lots and commercial rooftops in Brampton and Vaughan create secondary heat hotspots distinct from the downtown urban core.
- Urban parks with >40% canopy cover (e.g., High Park, Sunnybrook) show LST values 6–10°C cooler than adjacent built-up areas.
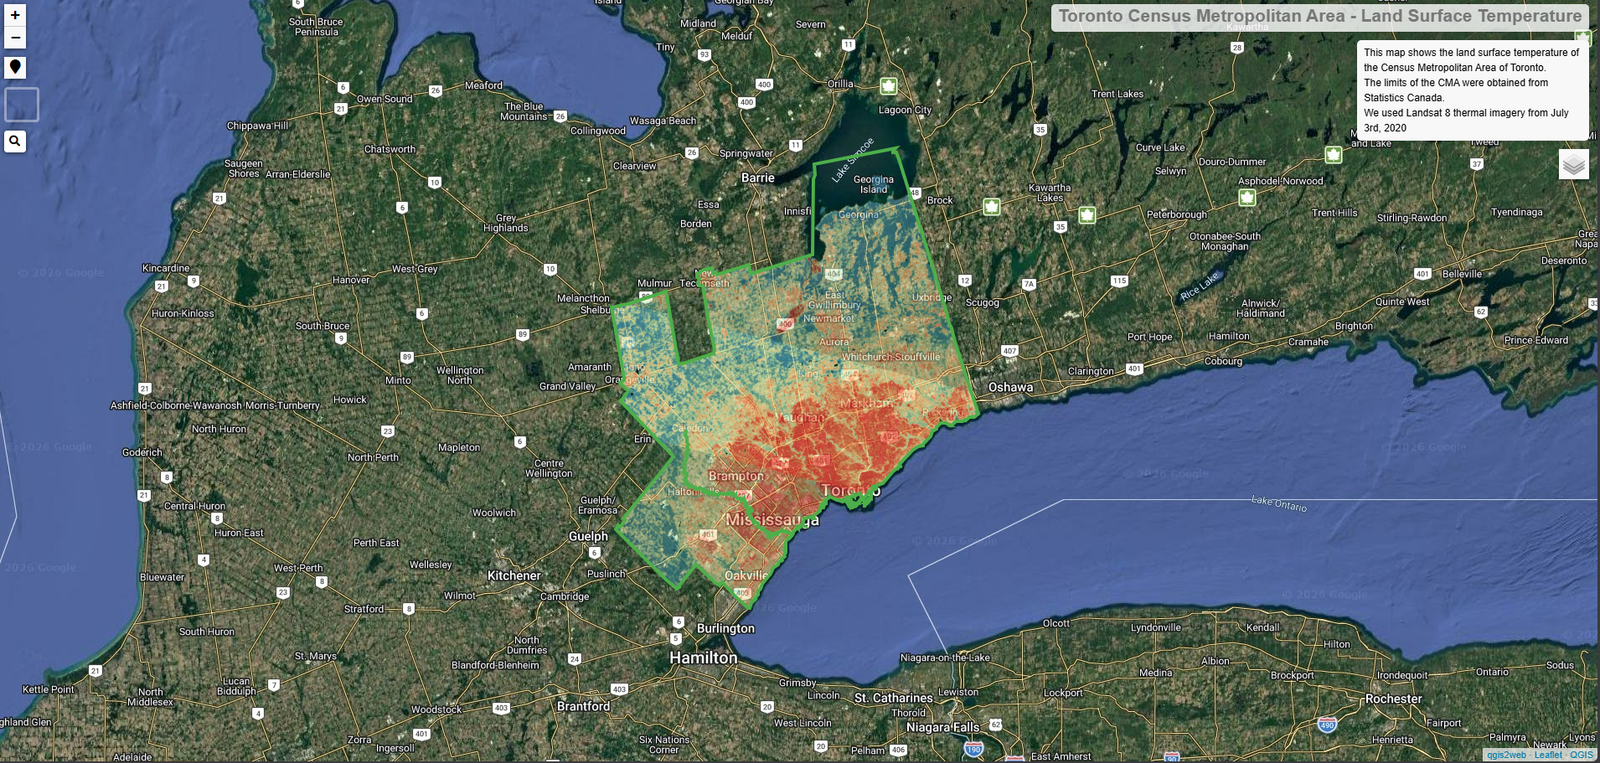
Land Surface Temperature (LST) derived from Landsat 8 TIRS Band 10 imagery, July 3, 2020. Red tones indicate hot urban surfaces; blue tones indicate cool vegetation and water bodies. CMA boundary from Statistics Canada.
Project Reference
This study is part of the urbanheatislands.com initiative, an open-access project dedicated to mapping and communicating urban heat island effects across Canadian cities using publicly available satellite data. This case study was commissioned by The Globe and Mail.
Need urban climate analysis for your region?
Contact us to discuss land surface temperature mapping, urban heat island studies, or custom geospatial analysis for your municipality or project area.